Net Income per Diluted Share of $0.99 for the Fourth Quarter and $10.84 for the Full Year of 2025
Core FFO per Share of $1.40 for the Fourth Quarter and $6.68 for the Full Year of 2025
North America Same Property NOI increased by 7.9% for the Fourth Quarter and 5.7% for the Full Year of 2025
Acquired 14 MH and RV Communities for $457.0 million and
Distributed Over $1.5 Billion of Capital to Shareholders,
Inclusive of Cash Distributions and Share Repurchases in 2025
Establishing Guidance for 2026, Expecting:
Core FFO per Share of $6.83 to $7.03
North American Same Property NOI Growth of 4.5% at the Midpoint; and
UK Same Property NOI Growth of 2.2% at the Midpoint
Southfield, MI, Feb. 24, 2026 (GLOBE NEWSWIRE) -- Sun Communities, Inc. (NYSE:SUI) (the "Company" or "SUI"), a real estate investment trust ("REIT") that owns and operates, or has an interest in, manufactured housing ("MH") and recreational vehicle ("RV") communities (collectively, the "properties"), today reported its fourth quarter and full year results for 2025.
Financial Results for the Quarter and Year Ended December 31, 2025
Non-GAAP Financial Measures
"I'm pleased to report that Sun delivered strong fourth quarter results, reflecting the strength of our platform and the quality of our team's execution," said Charles Young, Chief Executive Officer. "Our North America Same Property NOI increased 7.9% in the fourth quarter, reflecting strong underlying fundamentals across our portfolio. During 2025, we invested more than $450 million to acquire high-quality communities and returned over $1.5 billion to our shareholders. Our strategic transformation has created a streamlined, focused platform that is ideally positioned to benefit from the ongoing demand for affordable housing, and our best-in-class balance sheet provides us with exceptional financial flexibility. As we look ahead, I am confident that our strong operational momentum will deliver sustainable growth and create lasting value for all stakeholders, while providing exceptional communities and experiences for our residents and guests."
OPERATING HIGHLIGHTS
North America Portfolio Occupancy
Same Property Results
For the properties owned and operated by the Company since at least January 1, 2024, excluding properties classified as discontinued operations, the following table reflects the percentage changes for the quarter and year ended December 31, 2025, as compared to the same periods in 2024:
| Quarter Ended December 31, 2025 | Year Ended December 31, 2025 | ||||||||||||||||||||||
| North America | North America | ||||||||||||||||||||||
| MH | RV | Total | UK | MH | RV | Total | UK | ||||||||||||||||
| Revenue | 7.3 | % | 2.7 | % | 5.9 | % | 3.7 | % | 7.2 | % | — | % | 4.5 | % | 5.0 | % | |||||||
| Expense | 3.2 | % | 0.6 | % | 2.0 | % | 10.4 | % | 2.7 | % | 1.8 | % | 2.2 | % | 6.6 | % | |||||||
| NOI | 8.8 | % | 5.0 | % | 7.9 | % | (2.6) % | 8.9 | % | (1.4) % | 5.7 | % | 3.5 | % | |||||||||
| As of December 31, 2025 | |||||||||||||||||||||||
| MH | RV | MH / RV | UK | ||||||||||||||||||||
| Number of Properties | 280 | 156 | 436 | 51 | |||||||||||||||||||
North America Same Property adjusted blended occupancy for MH and RV increased by 40 basis points to 99.1% at December 31, 2025, from 98.7% at December 31, 2024.
INVESTMENT ACTIVITY
During the quarter ended December 31, 2025, as previously disclosed, the Company completed the acquisition of 11 MH and three Annual RV properties for total cash consideration of $457.0 million.
During the quarter ended December 31, 2025, the Company completed the following dispositions:
Subsequent to the quarter ended December 31, 2025, the Company acquired one MH property for total cash consideration of $17.0 million.
Refer to page 13 for additional details related to the Company's acquisition and disposition activity.
BALANCE SHEET, CAPITAL MARKETS ACTIVITY, AND OTHER ITEMS
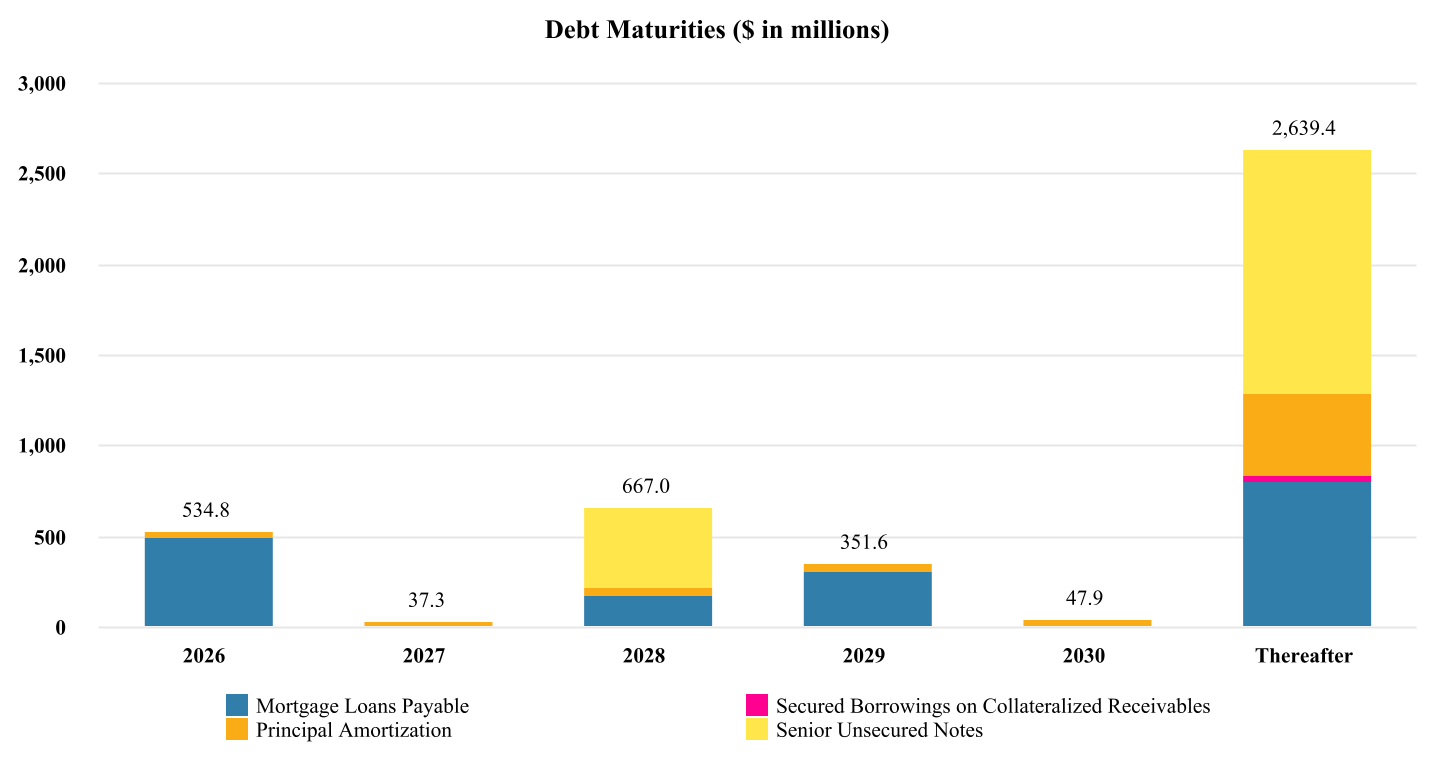
As of December 31, 2025, the Company had $4.3 billion in debt outstanding with a weighted average interest rate of 3.4% and a weighted average maturity of 7.1 years. At December 31, 2025, the Company's Net Debt to trailing twelve-month Recurring EBITDA ratio was 3.4 times.
Stock Repurchase Program
During the quarter ended December 31, 2025, the Company repurchased approximately 0.3 million shares of the Company's common stock at an average price of $124.14 per share for a total of $38.8 million. For the year ended December 31, 2025, the Company repurchased 4.3 million shares of the Company's common stock at an average price of $125.62 per share for a total of $539.1 million. Subsequent to the quarter ended December 31, 2025, through February 24, 2026, the Company repurchased approximately 0.5 million shares of the Company's common stock at an average price of $125.74 per share for a total of $57.3 million.
UK Ground Lease Transactions
For the year ended December 31, 2025, the Company repurchased the titles to 32 UK properties, previously controlled via ground leases, for $386.8 million, inclusive of taxes and fees, and recorded lease termination gains of $51.8 million. As of December 31, 2025, the Company no longer has a financial liability associated with ground leases in the UK.
Distribution Increase
The Company's Board of Directors has approved setting the quarterly distribution rate at $1.12 per common share and unit, an increase of $0.08, or approximately 8%, over the prior quarterly distribution rate of $1.04 per common share and unit.
The new quarterly rate equates to an annual distribution rate of $4.48 per common share and unit and is expected to commence with the first quarter distribution expected to be paid in April 2026. While the Board of Directors has adopted the new annual distribution policy, the amount of each quarterly distribution on the Company's common stock will be subject to approval by the Board of Directors.
2026 GUIDANCE
The Company is establishing full-year and first quarter 2026 guidance for diluted EPS and Core FFO per Share as follows:
| First Quarter Ending March 31, 2026 | Full Year Ending December 31, 2026 | |||||||||||||||
| Low | High | Low | High | |||||||||||||
| Diluted EPS attributable to the Consolidated Portfolio(a) | $ | 0.14 | $ | 0.22 | $ | 2.63 | $ | 2.83 | ||||||||
| Depreciation and amortization | 0.98 | 0.98 | 3.93 | 3.93 | ||||||||||||
| Gain on sale of assets | (0.04 | ) | (0.04 | ) | (0.17 | ) | (0.17 | ) | ||||||||
| Distributions on preferred OP units | 0.02 | 0.02 | 0.09 | 0.09 | ||||||||||||
| Noncontrolling interest | 0.01 | 0.01 | 0.12 | 0.12 | ||||||||||||
| Transaction costs and other non-recurring G&A expenses | 0.11 | 0.11 | 0.20 | 0.20 | ||||||||||||
| Difference in weighted average share count attributed to dilutive convertible securities | (0.01 | ) | (0.01 | ) | (0.11 | ) | (0.11 | ) | ||||||||
| Other adjustments(b) | 0.03 | 0.03 | 0.14 | 0.14 | ||||||||||||
| Core FFO per Share attributable to the Consolidated Portfolio(a)(b) | $ | 1.24 | $ | 1.32 | $ | 6.83 | $ | 7.03 | ||||||||
(a) The diluted share counts for both the quarter ending March 31, 2026 and the year ending December 31, 2026 are estimated to be 127.7 million, which assumes full conversion of all equity participating units, including common and preferred OP units, into the Company's common stock.
(b) Other adjustments consist primarily of business interruption insurance income and other items presented in the table Reconciliation of Net Income / (Loss) Attributable to SUI Common Shareholders to Core FFO on page 5.
(c) The Company's guidance translates forecasted results from operations in the UK using the relevant exchange rate provided in the table presented below. The impact of fluctuations in Canadian and Australian foreign currency rates on guidance are not material.
| Currencies | Exchange Rates | |
| U.S. dollar ("USD") / British pound sterling ("GBP") | 1.30 | |
| USD / Canadian dollar ("CAD") | 0.72 | |
| USD / Australian dollar ("AUD") | 0.64 |
Supplemental Guidance Tables:
| Same Property Portfolio (in millions and %) | FY 2025 Actual Results | Expected Change in 2026 | |||||||
| North America (MH and RV) | |||||||||
| Revenues from real property | $ | 1,458.1 | 3.7 | % | - | 4.4 | % | ||
| Total property operating expenses | 488.9 | 3.1 | % | - | 3.5 | % | |||
| Total North America Same Property NOI(a) | $ | 969.2 | 3.9 | % | - | 5.0 | % | ||
| MH NOI (282 properties) | $ | 688.3 | 5.4 | % | - | 6.4 | % | ||
| RV NOI (157 properties) | $ | 280.9 | 0.0 | % | - | 1.8 | % | ||
| UK (52 properties) | |||||||||
| Revenues from real property | $ | 159.6 | 5.1 | % | - | 5.9 | % | ||
| Total property operating expenses | 79.2 | 8.4 | % | - | 9.4 | % | |||
| Total UK Same Property NOI(a)(b) | $ | 80.4 | 0.9 | % | - | 3.4 | % | ||
For the first quarter ending March 31, 2026, the Company's guidance range assumes North America Same Property NOI growth of 3.2% - 4.4% and UK Same Property NOI growth of (1.7)% - 2.3% on a constant currency basis.
| Consolidated Portfolio Guidance For 2026 (in millions, excluding marinas) | FY 2025 Actual Results | Expected Results in FY 2026 at the Midpoint | ||||
| Ancillary NOI | $ | 28.0 | $ | 28.0 | ||
| Interest income | $ | 48.5 | $ | 20.0 | ||
| Brokerage commissions and other, net(c) | $ | 43.6 | $ | 45.5 | ||
| FFO contribution from North American home sales | $ | 6.6 | $ | 3.0 | ||
| FFO contribution from UK home sales | $ | 48.5 | $ | 49.5 | ||
| General and administrative expenses excluding non-recurring expenses | $ | 203.0 | $ | 212.0 | ||
| Interest expense | $ | 221.0 | $ | 149.5 | ||
| Current tax expense | $ | 10.8 | $ | 14.0 | ||
| Seasonality | 1Q26 | 2Q26 | 3Q26 | 4Q26 | ||||||||
| North America Same Property NOI: | ||||||||||||
| MH | 25 | % | 25 | % | 25 | % | 25 | % | ||||
| RV | 16 | % | 25 | % | 40 | % | 19 | % | ||||
| Total | 22 | % | 25 | % | 29 | % | 24 | % | ||||
| UK Same Property NOI | 12 | % | 28 | % | 39 | % | 21 | % | ||||
| Home Sales FFO: | ||||||||||||
| North America | — | % | 43 | % | 36 | % | 21 | % | ||||
| UK | 19 | % | 31 | % | 31 | % | 19 | % | ||||
| Consolidated Ancillary NOI | (15 | )% | 34 | % | 76 | % | 5 | % | ||||
| Consolidated EBITDA | 19 | % | 26 | % | 32 | % | 23 | % | ||||
| Core FFO per Share(d) | 19 | % | 26 | % | 33 | % | 22 | % | ||||
Preliminary 2026 Rental Rate Increase
The Company expects to realize the following rental rate increases, on average, during 2026:
| Average Rental Rate Increases Expected | ||
| North America | ||
| MH | 5.0 | % |
| Annual RV | 4.0 | % |
| UK | 4.1 | % |
| Footnotes to Supplemental Guidance Tables: | |||||
| (a) | Total North America Same Property results net $95.6 million and $101.0 million of utility revenue against the related utility expense in property operating expenses for 2025 results and 2026 guidance, respectively. Total UK Same Property results net $20.1 million and $21.7 million of utility revenue against the related utility expense in property operating expenses for 2025 results and 2026 guidance, respectively. | ||||
| (b) | The amounts in the UK Same Property Portfolio table reflect constant currency, as British pound sterling figures included within the 2025 actual amounts have been translated at the assumed exchange rates used for 2026 guidance. Refer to Real Property Operations - UK Same Property Portfolio page 11 for reported numbers. Prior to constant currency adjustments, the Company expects UK Same Property NOI to increase by (1.4)% to 1.0% in 2026. | ||||
| (c) | Brokerage commissions and other, net includes approximately $13.8 million and $12.8 million of business interruption income, and $16.4 million and $19.0 million of income from nonconsolidated affiliates for full year 2025 results and 2026 guidance, respectively. The business interruption income includes the pro rata recognition of the lump sum insurance settlement that was received during the quarter ended December 31, 2025. | ||||
| (d) | Assumes full conversion of all equity participating units, including common and preferred OP units, into the Company's common stock. | ||||
The estimates and assumptions presented above represent a range of possible outcomes and may differ materially from actual results. These estimates include contributions from all acquisitions, dispositions and capital markets activity completed through February 24, 2026. These estimates exclude all other prospective acquisitions, dispositions and capital markets activity. The estimates and assumptions are forward-looking based on the Company's current assessment of economic and market conditions and are subject to the other risks outlined below under the caption Cautionary Statement Regarding Forward-Looking Statements.
EARNINGS CONFERENCE CALL
A conference call to discuss fourth quarter results will be held on Wednesday, February 25, 2026 at 11:00 A.M. (ET). To participate, call toll-free at (877) 407-9039. Callers outside the U.S. or Canada can access the call at (201) 689-8470. A replay will be available following the call through March 11, 2026 and can be accessed toll-free by calling (844) 512-2921 or (412) 317-6671. The Conference ID number for the call and the replay is 13757256. The conference call will be available live on the Company's website located at www.suninc.com. The replay will also be available on the website.
CAUTIONARY STATEMENT REGARDING FORWARD-LOOKING STATEMENTS
This press release contains various "forward-looking statements" within the meaning of the Securities Act of 1933, as amended (the "Securities Act"), and the Securities Exchange Act of 1934, as amended (the "Exchange Act"), and the Company intends that such forward-looking statements will be subject to the safe harbors created thereby. For this purpose, any statements contained in this document that relate to expectations, beliefs, projections, future plans and strategies, trends or prospective events or developments, and similar expressions concerning matters that are not historical facts are deemed to be forward-looking statements. Words such as "forecasts," "intend," "goal," "estimate," "expect," "project," "projections," "plans," "predicts," "potential," "seeks," "anticipates," "should," "could," "may," "will," "designed to," "foreseeable future," "believe," "scheduled," "guidance," "target," and similar expressions are intended to identify forward-looking statements, although not all forward-looking statements contain these words. These forward-looking statements reflect the Company's current views with respect to future events and financial performance, but involve known and unknown risks, uncertainties, and other factors, both general and specific to the matters discussed in this document, some of which are beyond the Company's control. These risks, uncertainties, and other factors may cause the Company's actual results to be materially different from any future results expressed or implied by such forward-looking statements. In addition to the risks described under "Risk Factors" contained in the Company's Annual Report on Form 10-K for the year ended December 31, 2024, in Part II, Item 1A of the Company's Quarterly Report on Form 10-Q for the three months ended March 31, 2025, and in the Company's other filings with the Securities and Exchange Commission, from time to time, such risks, uncertainties and other factors include, but are not limited to:
| ∙ | The Company's liquidity and refinancing demands; |
| ∙ | The Company's ability to obtain or refinance maturing debt; |
| ∙ | The Company's ability to maintain compliance with covenants contained in its debt facilities and its unsecured notes; |
| ∙ | Availability of capital; |
| ∙ | General volatility of the capital markets and the market price of shares of the Company's capital stock; |
| ∙ | Increases in interest rates and operating costs, including insurance premiums, real estate taxes, and utilities; |
| ∙ | Difficulties in the Company's ability to evaluate, finance, complete, and integrate acquisitions, developments, and expansions successfully; |
| ∙ | Competitive market forces; |
| ∙ | The ability of purchasers of manufactured homes to obtain financing; |
| ∙ | The level of repossessions of manufactured homes; |
| ∙ | The Company's ability to maintain effective internal control over financial reporting and disclosure controls and procedures; |
| ∙ | Expectations regarding the amount or frequency of impairment losses; |
| ∙ | Changes in general economic conditions, including inflation, deflation, energy costs, the real estate industry, the effects of tariffs or threats of tariffs, wars or other international conflicts, trade wars, immigration issues, supply chain disruptions, and the markets within which the Company operates; |
| ∙ | Changes in foreign currency exchange rates, including between the U.S. dollar and each of the British pound sterling, Canadian dollar, and Australian dollar; |
| ∙ | The Company's ability to maintain its status as a REIT; |
| ∙ | Changes in real estate and zoning laws and regulations; |
| ∙ | The Company's ability to maintain rental rates and occupancy levels; |
| ∙ | Legislative or regulatory changes, including changes to laws governing the taxation of REITs; |
| ∙ | Outbreaks of disease and related restrictions on business operations; |
| ∙ | Risks related to natural disasters such as hurricanes, earthquakes, floods, droughts, and wildfires; and |
| ∙ | Litigation, judgments or settlements, including costs associated with prosecuting or defending claims and any adverse outcomes. |
Readers are cautioned not to place undue reliance on these forward-looking statements, which speak only as of the date the statement was made. The Company undertakes no obligation to publicly update or revise any forward-looking statements included or incorporated by reference into this document, whether as a result of new information, future events, changes in the Company's expectations or otherwise, except as required by law.
Although the Company believes that the expectations reflected in the forward-looking statements are reasonable, the Company cannot guarantee future results, levels of activity, performance or achievements. All written and oral forward-looking statements attributable to the Company or persons acting on the Company's behalf are qualified in their entirety by these cautionary statements.
Company Overview and Investor Information
The Company
Established in 1975, Sun Communities, Inc. became a publicly owned corporation in December 1993. The Company is a fully integrated REIT listed on the New York Stock Exchange under the symbol: SUI. As of December 31, 2025, the Company owned, operated, or had an interest in a portfolio of 513 developed MH, RV, and UK properties comprising approximately 178,650 developed sites in the U.S., Canada, and the U.K.
For more information about the Company, please visit www.suninc.com.
| Company Contacts | |
| Investor Relations | |
| Sara Ismail, Senior Vice President | |
| (248) 208-2500 | |
| investorrelations@suncommunities.com |
| Corporate Debt Ratings | |
| Moody's | Baa2 | Stable |
| S&P | BBB+ | Stable |
Portfolio Overview as of December 31, 2025
| MH & RV Properties | |||||||||||||
| Properties | MH & Annual RV | Transient RV Sites | Total Sites | Sites for Development | |||||||||
| Location | Sites | Occupancy % | |||||||||||
| North America | |||||||||||||
| Florida | 125 | 42,580 | 97.1 | % | 4,610 | 47,190 | 1,310 | ||||||
| Michigan | 89 | 34,190 | 97.9 | % | 470 | 34,660 | 1,340 | ||||||
| California | 37 | 7,020 | 99.5 | % | 1,800 | 8,820 | 570 | ||||||
| Texas | 29 | 9,320 | 98.6 | % | 1,580 | 10,900 | 3,700 | ||||||
| Connecticut | 16 | 1,900 | 96.8 | % | 100 | 2,000 | — | ||||||
| Maine | 15 | 2,570 | 97.4 | % | 960 | 3,530 | 200 | ||||||
| New Jersey | 13 | 3,610 | 100.0 | % | 890 | 4,500 | 10 | ||||||
| Arizona | 11 | 4,190 | 98.0 | % | 810 | 5,000 | 1,120 | ||||||
| Colorado | 11 | 2,960 | 92.4 | % | 910 | 3,870 | 1,390 | ||||||
| Indiana | 10 | 2,810 | 98.8 | % | 1,010 | 3,820 | 180 | ||||||
| New York | 10 | 1,560 | 99.2 | % | 1,390 | 2,950 | 780 | ||||||
| Maryland | 10 | 900 | 99.1 | % | 1,390 | 2,290 | 260 | ||||||
| Other | 84 | 19,870 | 99.2 | % | 7,630 | 27,500 | 1,210 | ||||||
| Total | 460 | 133,480 | 97.9 | % | 23,550 | 157,030 | 12,070 | ||||||
| Properties | UK Properties | Transient Sites | Total Sites | Sites for Development | |||||||||
| Location | Sites | Occupancy % | |||||||||||
| United Kingdom | 53 | 17,750 | 89.1 | % | 3,870 | 21,620 | 2,820 | ||||||
| Properties | Total Sites | |||||||
| Total Portfolio | 513 | 178,650 |
Financial and Operating Highlights
($ in millions, except Per Share amounts, Unaudited)
| Quarters Ended | |||||||||||||||||||
| 12/31/2025 | 9/30/2025 | 6/30/2025 | 3/31/2025 | 12/31/2024 | |||||||||||||||
| Financial Information | |||||||||||||||||||
| Basic earnings / (loss) per share from continuing operations | $ | 0.90 | $ | (0.05 | ) | $ | (1.23 | ) | $ | (0.19 | ) | $ | (1.84 | ) | |||||
| Basic earnings / (loss) per share from discontinued operations | 0.09 | 0.12 | 11.25 | (0.15 | ) | 0.08 | |||||||||||||
| Basic earnings / (loss) per share | $ | 0.99 | $ | 0.07 | $ | 10.02 | $ | (0.34 | ) | $ | (1.76 | ) | |||||||
| Diluted earnings / (loss) per share from continuing operations | $ | 0.90 | $ | (0.05 | ) | $ | (1.23 | ) | $ | (0.19 | ) | $ | (1.85 | ) | |||||
| Diluted earnings / (loss) per share from discontinued operations | 0.09 | 0.12 | 11.25 | (0.15 | ) | 0.08 | |||||||||||||
| Diluted earnings / (loss) per share | $ | 0.99 | $ | 0.07 | $ | 10.02 | $ | (0.34 | ) | $ | (1.77 | ) | |||||||
| Cash distributions declared per common share(a) | $ | 1.04 | $ | 1.04 | $ | 1.04 | $ | 0.94 | $ | 0.94 | |||||||||
| FFO per Share(b) | $ | 2.15 | $ | 2.18 | $ | 1.36 | $ | 1.06 | $ | 1.30 | |||||||||
| Core FFO per Share(b) | $ | 1.40 | $ | 2.28 | $ | 1.76 | $ | 1.26 | $ | 1.41 | |||||||||
| Real Property NOI(b) | |||||||||||||||||||
| MH | $ | 178.8 | $ | 171.8 | $ | 168.6 | $ | 172.5 | $ | 161.9 | |||||||||
| RV | 53.3 | 115.5 | 72.9 | 44.7 | 50.4 | ||||||||||||||
| UK | 16.5 | 32.9 | 22.1 | 9.2 | 16.3 | ||||||||||||||
| Total | $ | 248.6 | $ | 320.2 | $ | 263.6 | $ | 226.4 | $ | 228.6 | |||||||||
| Recurring EBITDA(b) | $ | 206.2 | $ | 335.7 | $ | 291.3 | $ | 236.7 | $ | 271.5 | |||||||||
| TTM Recurring EBITDA / Interest(b) | 4.9 x | 4.4 x | 3.8 x | 3.6 x | 3.5 x | ||||||||||||||
| Net Debt / TTM Recurring EBITDA(b) | 3.4 x | 3.3 x | 2.9 x | 5.9 x | 6.0 x | ||||||||||||||
| Balance Sheet | |||||||||||||||||||
| Total assets | $ | 12,522.9 | $ | 12,800.3 | $ | 13,362.1 | $ | 16,505.6 | $ | 16,549.4 | |||||||||
| Total debt | $ | 4,258.7 | $ | 4,271.7 | $ | 4,283.5 | $ | 7,348.1 | $ | 7,352.8 | |||||||||
| Total liabilities | $ | 5,194.4 | $ | 5,438.0 | $ | 5,570.0 | $ | 9,235.4 | $ | 9,096.8 | |||||||||
| Operating Information | |||||||||||||||||||
| Properties | |||||||||||||||||||
| MH | 294 | 284 | 284 | 284 | 287 | ||||||||||||||
| RV | 166 | 164 | 164 | 165 | 167 | ||||||||||||||
| UK | 53 | 53 | 53 | 53 | 53 | ||||||||||||||
| Total | 513 | 501 | 501 | 502 | 507 | ||||||||||||||
| Sites | |||||||||||||||||||
| MH | 100,150 | 97,070 | 97,380 | 97,320 | 97,430 | ||||||||||||||
| Annual RV | 33,330 | 32,480 | 32,100 | 31,960 | 32,100 | ||||||||||||||
| Transient | 23,550 | 23,560 | 23,440 | 23,810 | 24,830 | ||||||||||||||
| UK annual | 17,750 | 17,650 | 17,510 | 17,510 | 17,690 | ||||||||||||||
| UK transient | 3,870 | 3,920 | 4,020 | 4,250 | 4,340 | ||||||||||||||
| Total sites | 178,650 | 174,680 | 174,450 | 174,850 | 176,390 | ||||||||||||||
| Occupancy | |||||||||||||||||||
| MH | 97.2 | % | 97.9 | % | 97.4 | % | 97.3 | % | 97.3 | % | |||||||||
| Annual RV | 100.0 | % | 100.0 | % | 100.0 | % | 100.0 | % | 100.0 | % | |||||||||
| Blended MH and annual RV | 97.9 | % | 98.4 | % | 98.1 | % | 98.0 | % | 98.0 | % | |||||||||
| UK annual | 89.1 | % | 90.7 | % | 90.3 | % | 89.8 | % | 89.7 | % | |||||||||
| MH and RV Revenue Producing Site Net Gains(c) | |||||||||||||||||||
| MH leased sites, net | 178 | 152 | 170 | 47 | 406 | ||||||||||||||
| RV leased sites, net | (37 | ) | 371 | 288 | (31 | ) | 304 | ||||||||||||
| Total leased sites, net | 141 | 523 | 458 | 16 | 710 | ||||||||||||||
(a) During the quarter ended June 30, 2025, the Company also paid a one-time special cash distribution of $4.00 per common share and unit.
(b) Refer to Definition and Notes for additional information.
(c) Revenue producing site net gains do not include occupied sites acquired during the year.
Consolidated Balance Sheets
($ in millions, Unaudited)
| December 31, 2025 | December 31, 2024 | ||||||
| Assets | |||||||
| Land | $ | 3,503.2 | $ | 3,461.5 | |||
| Land improvements and buildings | 9,286.8 | 9,058.7 | |||||
| Rental homes and improvements | 940.2 | 834.1 | |||||
| Furniture, fixtures and equipment | 769.8 | 739.2 | |||||
| Investment property | 14,500.0 | 14,093.5 | |||||
| Accumulated depreciation | (3,598.3 | ) | (3,228.4 | ) | |||
| Investment property, net | 10,901.7 | 10,865.1 | |||||
| Cash, cash equivalents and restricted cash(a) | 636.1 | 57.1 | |||||
| Inventory of manufactured homes | 142.9 | 129.8 | |||||
| Notes and other receivables, net | 332.1 | 430.1 | |||||
| Collateralized receivables, net(a) | 43.2 | 51.2 | |||||
| Goodwill | 9.5 | 9.5 | |||||
| Other intangible assets, net | 101.5 | 102.5 | |||||
| Other assets, net | 355.9 | 442.4 | |||||
| Assets held for sale and discontinued operations, net(a) | — | 4,461.7 | |||||
| Total Assets | $ | 12,522.9 | $ | 16,549.4 | |||
| Liabilities | |||||||
| Mortgage loans payable | $ | 2,429.0 | $ | 3,212.2 | |||
| Secured borrowings on collateralized receivables(a) | 43.2 | 51.2 | |||||
| Unsecured debt | 1,786.5 | 4,089.4 | |||||
| Distributions payable | 131.1 | 122.6 | |||||
| Advanced reservation deposits and rent | 255.9 | 249.4 | |||||
| Accrued expenses and accounts payable | 228.1 | 265.8 | |||||
| Other liabilities | 320.6 | 819.3 | |||||
| Liabilities held for sale and discontinued operations, net(a) | — | 286.9 | |||||
| Total Liabilities | 5,194.4 | 9,096.8 | |||||
| Commitments and contingencies | |||||||
| Temporary equity | 255.7 | 259.8 | |||||
| Shareholders' Equity | |||||||
| Common stock | 1.2 | 1.3 | |||||
| Additional paid-in capital | 9,563.1 | 9,864.2 | |||||
| Accumulated other comprehensive income / (loss) | 26.5 | (7.9 | ) | ||||
| Distributions in excess of accumulated earnings | (2,634.7 | ) | (2,775.9 | ) | |||
| Total SUI Shareholders' Equity | 6,956.1 | 7,081.7 | |||||
| Noncontrolling interests | |||||||
| Common and preferred OP units | 116.3 | 110.4 | |||||
| Consolidated entities | 0.4 | 0.7 | |||||
| Total noncontrolling interests | 116.7 | 111.1 | |||||
| Total Shareholders' Equity | 7,072.8 | 7,192.8 | |||||
| Total Liabilities, Temporary Equity and Shareholders' Equity | $ | 12,522.9 | $ | 16,549.4 | |||
(a) Refer to Definitions and Notes for additional information.
Consolidated Statements of Operations
($ in millions, except for per share amounts, Unaudited)
| Quarter Ended December 31, | Year Ended December 31, | |||||||||||||||||||
| 2025 | 2024 | % Change | 2025 | 2024 | % Change | |||||||||||||||
| Revenues | ||||||||||||||||||||
| Real property (excluding transient)(a) | $ | 376.1 | $ | 349.1 | 7.7 | % | $ | 1,483.0 | $ | 1,407.2 | 5.4 | % | ||||||||
| Real property - transient | 37.4 | 38.7 | (3.4) % | 282.8 | 295.9 | (4.4) % | ||||||||||||||
| Home sales | 70.9 | 88.2 | (19.6) % | 333.8 | 369.9 | (9.8) % | ||||||||||||||
| Ancillary | 18.6 | 17.6 | 5.7 | % | 134.0 | 132.5 | 1.1 | % | ||||||||||||
| Interest | 10.3 | 5.1 | 102.0 | % | 48.5 | 20.1 | 141.3 | % | ||||||||||||
| Brokerage commissions and other, net | 1.9 | 15.9 | (88.1) % | 24.0 | 34.9 | (31.2) % | ||||||||||||||
| Total Revenues | 515.2 | 514.6 | 0.1 | % | 2,306.1 | 2,260.5 | 2.0 | % | ||||||||||||
| Expenses | ||||||||||||||||||||
| Property operating and maintenance(a) | 137.9 | 133.0 | 3.7 | % | 595.9 | 584.0 | 2.0 | % | ||||||||||||
| Real estate tax | 27.0 | 26.2 | 3.1 | % | 111.1 | 103.8 | 7.0 | % | ||||||||||||
| Home costs and selling | 63.3 | 70.1 | (9.7) % | 263.8 | 273.1 | (3.4) % | ||||||||||||||
| Ancillary | 18.4 | 18.0 | 2.2 | % | 106.0 | 108.9 | (2.7) % | |||||||||||||
| General and administrative | 62.7 | 60.2 | 4.2 | % | 236.7 | 230.5 | 2.7 | % | ||||||||||||
| Catastrophic event-related charges, net | 0.1 | 13.3 | (99.2) % | 1.2 | 23.6 | (94.9) % | ||||||||||||||
| Depreciation and amortization | 130.6 | 122.4 | 6.7 | % | 507.9 | 490.5 | 3.5 | % | ||||||||||||
| Asset impairments(a) | 30.7 | 36.3 | (15.4) % | 386.7 | 66.7 | 3.5 | % | |||||||||||||
| Goodwill impairment | — | 180.8 | (100.0) % | — | 180.8 | (100.0) % | ||||||||||||||
| Loss on extinguishment of debt | — | — | N/A | 104.0 | 1.4 | N/M | ||||||||||||||
| Interest | 39.2 | 83.2 | (52.9) % | 221.0 | 350.3 | (36.9) % | ||||||||||||||
| Total Expenses | 509.9 | 743.5 | (31.4) % | 2,534.3 | 2,413.6 | 5.0 | % | |||||||||||||
| Income / (Loss) Before Other Items | 5.3 | (228.9 | ) | N/M | (228.2 | ) | (153.1 | ) | 49.1 | % | ||||||||||
| Gain / (loss) on foreign currency exchanges | 1.2 | (19.6 | ) | N/M | 26.7 | (25.8 | ) | N/M | ||||||||||||
| Gain on dispositions of properties, net | 8.8 | 16.3 | (46.0) % | 5.1 | 202.9 | N/M | ||||||||||||||
| Other income / (expense), net(a) | 77.2 | (2.5 | ) | N/M | 133.9 | (6.8 | ) | N/M | ||||||||||||
| Loss on remeasurement of notes receivable | — | (35.4 | ) | (100.0) % | (1.6 | ) | (36.4 | ) | (95.6) % | |||||||||||
| Income from nonconsolidated affiliates | 5.3 | 3.0 | 76.7 | % | 16.4 | 9.5 | 72.6 | % | ||||||||||||
| Gain / (loss) on remeasurement of investment in nonconsolidated affiliates | 0.2 | 0.1 | 100.0 | % | (0.9 | ) | 6.6 | N/M | ||||||||||||
| Current tax benefit / (expense) | 1.0 | 2.4 | (58.3) % | (10.8 | ) | (3.6 | ) | 200.0 | % | |||||||||||
| Deferred tax benefit | 20.6 | 23.1 | (10.8) % | 60.0 | 39.6 | 51.5 | % | |||||||||||||
| Net Income / (Loss) from Continuing Operations | 119.6 | (241.5 | ) | N/M | 0.6 | 32.9 | (98.2) % | |||||||||||||
| Income from discontinued operations, net(a) | 11.0 | 10.5 | 4.8 | % | 1,429.6 | 74.2 | N/M | |||||||||||||
| Net Income / (Loss) | 130.6 | (231.0 | ) | N/M | 1,430.2 | 107.1 | N/M | |||||||||||||
| Less: Preferred return to preferred OP units / equity interests | 3.1 | 3.2 | (3.1) % | 12.6 | 12.8 | (1.6) % | ||||||||||||||
| Less: Income / (loss) attributable to noncontrolling interests | 5.6 | (9.8 | ) | N/M | 56.4 | 5.3 | N/M | |||||||||||||
| Net Income / (Loss) Attributable to SUI Common Shareholders | $ | 121.9 | $ | (224.4 | ) | N/M | $ | 1,361.2 | $ | 89.0 | N/M | |||||||||
| Weighted average common shares outstanding - basic(a) | 122.8 | 126.5 | (2.9) % | 124.9 | 124.5 | 0.3 | % | |||||||||||||
| Weighted average common shares outstanding - diluted(a) | 122.8 | 129.7 | (5.3) % | 124.9 | 127.2 | (1.8) % | ||||||||||||||
| Basic earnings / (loss) per share from continuing operations | $ | 0.90 | $ | (1.84 | ) | N/M | $ | (0.61 | ) | $ | 0.12 | N/M | ||||||||
| Basic earnings per share from discontinued operations | 0.09 | 0.08 | 12.5 | % | 11.45 | 0.59 | N/M | |||||||||||||
| Basic earnings / (loss) per share | $ | 0.99 | $ | (1.76 | ) | N/M | $ | 10.84 | $ | 0.71 | N/M | |||||||||
| Diluted earnings / (loss) per share from continuing operations(b) | $ | 0.90 | $ | (1.85 | ) | N/M | $ | (0.61 | ) | $ | 0.12 | N/M | ||||||||
| Diluted earnings per share from discontinued operations(b) | 0.09 | 0.08 | 12.5 | % | 11.45 | 0.59 | N/M | |||||||||||||
| Diluted earnings / (loss) per share(b) | $ | 0.99 | $ | (1.77 | ) | N/M | $ | 10.84 | $ | 0.71 | N/M | |||||||||
(a) Refer to Definitions and Notes for additional information.
(b) Excludes the effect of certain anti-dilutive convertible securities.
N/M = Not meaningful. N/A = Not applicable.
Reconciliation of Net Income / (Loss) Attributable to SUI Common Shareholders to Core FFO
($ in millions, except for per share data, Unaudited)
| Quarter Ended December 31, | Year Ended December 31, | ||||||||||||||
| 2025 | 2024 | 2025 | 2024 | ||||||||||||
| Net Income / (Loss) Attributable to SUI Common Shareholders | $ | 121.9 | $ | (224.4 | ) | $ | 1,361.2 | $ | 89.0 | ||||||
| Adjustments | |||||||||||||||
| Depreciation and amortization - continuing operations(a) | 128.1 | 121.7 | 501.0 | 487.6 | |||||||||||
| Depreciation and amortization - discontinued operations(a) | — | 47.7 | 36.2 | 189.9 | |||||||||||
| Depreciation on nonconsolidated affiliates | 0.2 | 0.2 | 0.8 | 0.5 | |||||||||||
| Asset impairments - continuing operations(a) | 30.7 | 36.3 | 386.7 | 66.7 | |||||||||||
| Asset impairments - discontinued operations(a) | — | 2.6 | 2.3 | 4.7 | |||||||||||
| Goodwill impairment | — | 180.8 | — | 180.8 | |||||||||||
| (Gain) / loss on remeasurement of investment in nonconsolidated affiliates | (0.2 | ) | (0.1 | ) | 0.9 | (6.6 | ) | ||||||||
| Loss on remeasurement of notes receivable | — | 35.4 | 1.6 | 36.4 | |||||||||||
| Gain on dispositions of properties, including tax effect - continuing operations | (9.2 | ) | (15.1 | ) | (5.5 | ) | (203.6 | ) | |||||||
| Gain on dispositions of properties, including tax effect - discontinued operations | (1.8 | ) | — | (1,460.6 | ) | — | |||||||||
| Add: Returns on preferred OP units | 3.1 | 3.2 | 12.4 | 12.8 | |||||||||||
| Add: Income / (loss) attributable to noncontrolling interests | 5.6 | (9.8 | ) | 56.4 | 5.3 | ||||||||||
| Gain on disposition of assets, net | (3.1 | ) | (6.0 | ) | (14.9 | ) | (27.1 | ) | |||||||
| FFO(a)(c)(d)(e) | $ | 275.3 | $ | 172.5 | $ | 878.5 | $ | 836.4 | |||||||
| Adjustments | |||||||||||||||
| Business combination expense - discontinued operations | — | — | — | 0.4 | |||||||||||
| Acquisition and other transaction costs - continuing operations(a) | 1.5 | 3.1 | 19.8 | 16.0 | |||||||||||
| Acquisition and other transaction costs - discontinued operations(a) | 0.2 | 0.6 | 63.8 | 3.6 | |||||||||||
| Loss on extinguishment of debt | — | — | 104.0 | 1.4 | |||||||||||
| Catastrophic event-related charges, net - continuing operations | 0.1 | 13.3 | 1.2 | 23.6 | |||||||||||
| Catastrophic event-related charges, net - discontinued operations | — | 3.4 | — | 3.5 | |||||||||||
| Loss of earnings - catastrophic event-related charges, net(a) | 3.1 | (8.1 | ) | 5.6 | 3.4 | ||||||||||
| Accelerated deferred compensation amortization | 5.7 | 0.5 | 7.7 | 1.2 | |||||||||||
| (Gain) / loss on foreign currency exchanges | (1.2 | ) | 19.6 | (26.7 | ) | 25.8 | |||||||||
| Deferred tax benefit | (20.6 | ) | (23.1 | ) | (60.0 | ) | (39.6 | ) | |||||||
| Long term lease termination (gains) / losses | (7.3 | ) | — | (51.4 | ) | 1.1 | |||||||||
| Gain on insurance settlement | (68.5 | ) | — | (68.5 | ) | — | |||||||||
| Other adjustments, net - continuing operations(a) | 0.1 | 4.8 | (7.1 | ) | 20.1 | ||||||||||
| Other adjustments, net - discontinued operations(a) | (9.4 | ) | — | 5.4 | (10.0 | ) | |||||||||
| Core FFO(a)(b)(c)(d) | $ | 179.0 | $ | 186.6 | $ | 872.3 | $ | 886.9 | |||||||
| Weighted Average Common Shares and OP Units Outstanding(a)(b) | 128.2 | 132.3 | 130.7 | 130.2 | |||||||||||
| FFO per Share(a)(b)(c)(d) | $ | 2.15 | $ | 1.30 | $ | 6.72 | $ | 6.42 | |||||||
| Core FFO per Share(a)(b)(c)(d) | $ | 1.40 | $ | 1.41 | $ | 6.68 | $ | 6.81 | |||||||
(a) Refer to Definitions and Notes for additional information.
(b) Assumes full conversion of all equity participating units, including common and preferred OP units, into the Company's common stock, and has no material impact on previously reported results.
(c) FFO and Core FFO include discontinued operations activity of $9.2 million or $0.07 per Share, and $0.0 million or $0.00 per Share, respectively, during the quarter ended December 31, 2025, and $60.6 million or $0.46 per Share, and $64.6 million or $0.49 per Share, respectively, during the quarter ended December 31, 2024.
(d) FFO and Core FFO include discontinued operations activity of $7.4 million or $0.06 per Share, and $76.4 million or $0.58 per Share, respectively, during the year ended December 31, 2025, and $268.7 million or $2.06 per Share, and $266.3 million or $2.05 per Share, respectively, during the year ended December 31, 2024.
Reconciliation of Net Income / (Loss) Attributable to SUI Common Shareholders to NOI
($ in millions, Unaudited)
| Quarter Ended December 31, | Year Ended December 31, | ||||||||||||||
| 2025 | 2024 | 2025 | 2024 | ||||||||||||
| Net Income / (Loss) Attributable to SUI Common Shareholders | $ | 121.9 | $ | (224.4 | ) | $ | 1,361.2 | $ | 89.0 | ||||||
| Interest income | (10.3 | ) | (5.1 | ) | (48.5 | ) | (20.1 | ) | |||||||
| Brokerage commissions and other revenues, net | (1.9 | ) | (15.9 | ) | (24.0 | ) | (34.9 | ) | |||||||
| General and administrative | 62.7 | 60.2 | 236.7 | 230.5 | |||||||||||
| Catastrophic event-related charges, net | 0.1 | 13.3 | 1.2 | 23.6 | |||||||||||
| Depreciation and amortization | 130.6 | 122.4 | 507.9 | 490.5 | |||||||||||
| Asset impairments(a) | 30.7 | 36.3 | 386.7 | 66.7 | |||||||||||
| Goodwill impairment | — | 180.8 | — | 180.8 | |||||||||||
| Loss on extinguishment of debt | — | — | 104.0 | 1.4 | |||||||||||
| Interest expense | 39.2 | 83.2 | 221.0 | 350.3 | |||||||||||
| (Gain) / loss on foreign currency exchanges | (1.2 | ) | 19.6 | (26.7 | ) | 25.8 | |||||||||
| Gain on disposition of properties | (8.8 | ) | (16.3 | ) | (5.1 | ) | (202.9 | ) | |||||||
| Other (income) / expense, net(a) | (77.2 | ) | 2.5 | (133.9 | ) | 6.8 | |||||||||
| Loss on remeasurement of notes receivable | — | 35.4 | 1.6 | 36.4 | |||||||||||
| Income from nonconsolidated affiliates | (5.3 | ) | (3.0 | ) | (16.4 | ) | (9.5 | ) | |||||||
| (Gain) / loss on remeasurement of investment in nonconsolidated affiliates | (0.2 | ) | (0.1 | ) | 0.9 | (6.6 | ) | ||||||||
| Current tax (benefit) / expense | (1.0 | ) | (2.4 | ) | 10.8 | 3.6 | |||||||||
| Deferred tax benefit | (20.6 | ) | (23.1 | ) | (60.0 | ) | (39.6 | ) | |||||||
| Net income from discontinued operations, net | (11.0 | ) | (10.5 | ) | (1,429.6 | ) | (74.2 | ) | |||||||
| Add: Preferred return to preferred OP units / equity interests | 3.1 | 3.2 | 12.6 | 12.8 | |||||||||||
| Add: Income / (loss) attributable to noncontrolling interests | 5.6 | (9.8 | ) | 56.4 | 5.3 | ||||||||||
| NOI | $ | 256.4 | $ | 246.3 | $ | 1,156.8 | $ | 1,135.7 | |||||||
| Quarter Ended December 31, | Year Ended December 31, | |||||||||||
| 2025 | 2024 | 2025 | 2024 | |||||||||
| Real property NOI(a) | $ | 248.6 | $ | 228.6 | $ | 1,058.8 | $ | 1,015.3 | ||||
| Home sales NOI(a) | 7.6 | 18.1 | 70.0 | 96.8 | ||||||||
| Ancillary NOI(a) | 0.2 | (0.4 | ) | 28.0 | 23.6 | |||||||
| NOI(a) | $ | 256.4 | $ | 246.3 | $ | 1,156.8 | $ | 1,135.7 | ||||
(a) Refer to Definitions and Notes for additional information. Excludes properties classified as discontinued operations. During the quarter and year ended December 31, 2025, the Company's marina properties generated total NOI of $0.0 million and $93.7 million, respectively. During the quarter and year ended December 31, 2024, the Company's marina properties generated total NOI of $79.4 million and $322.7 million, respectively, which was recorded within Income from discontinued operations, net on the Consolidated Statements of Operations. Refer to the section "Discontinued Operations" within the Definitions and Notes for additional information.
Reconciliation of Net Income / (Loss) Attributable to SUI Common Shareholders to Recurring EBITDA
($ in millions, Unaudited)
| Quarter Ended December 31, | Year Ended December 31, | ||||||||||||||
| 2025 | 2024 | 2025 | 2024 | ||||||||||||
| Net Income / (Loss) Attributable to SUI Common Shareholders | $ | 121.9 | $ | (224.4 | ) | $ | 1,361.2 | $ | 89.0 | ||||||
| Adjustments | |||||||||||||||
| Depreciation and amortization - continuing operations | 130.6 | 122.4 | 507.9 | 490.5 | |||||||||||
| Depreciation and amortization - discontinued operations | — | 47.8 | 36.3 | 190.2 | |||||||||||
| Asset impairments - continuing operations(a) | 30.7 | 36.3 | 386.7 | 66.7 | |||||||||||
| Asset impairments - discontinued operations(a) | — | 2.6 | 2.3 | 4.7 | |||||||||||
| Goodwill impairment | — | 180.8 | — | 180.8 | |||||||||||
| Loss on extinguishment of debt | — | — | 104.0 | 1.4 | |||||||||||
| Interest expense - continuing operations | 39.2 | 83.2 | 221.0 | 350.3 | |||||||||||
| Interest expense - discontinued operations | — | — | — | 0.1 | |||||||||||
| Current tax (benefit) / expense - continuing operations | (1.0 | ) | (2.4 | ) | 10.8 | 3.6 | |||||||||
| Current tax expense - discontinued operations | 1.2 | 0.2 | 3.5 | 0.7 | |||||||||||
| Deferred tax benefit | (20.6 | ) | (23.1 | ) | (60.0 | ) | (39.6 | ) | |||||||
| Income from nonconsolidated affiliates | (5.3 | ) | (3.0 | ) | (16.4 | ) | (9.5 | ) | |||||||
| Less: Gain on dispositions of properties - continuing operations | (8.8 | ) | (16.3 | ) | (5.1 | ) | (202.9 | ) | |||||||
| Less: Gain on dispositions of properties - discontinued operations | (2.8 | ) | — | (1,463.2 | ) | — | |||||||||
| Less: Gain on dispositions of assets, net | (3.1 | ) | (6.0 | ) | (14.9 | ) | (27.1 | ) | |||||||
| EBITDAre(a) | $ | 282.0 | $ | 198.1 | $ | 1,074.1 | $ | 1,098.9 | |||||||
| Adjustments | |||||||||||||||
| Transaction costs - discontinued operations(b) | 0.3 | N/A | 63.4 | N/A | |||||||||||
| Catastrophic event-related charges, net - continuing operations | 0.1 | 13.3 | 1.2 | 23.6 | |||||||||||
| Catastrophic event-related charges, net - discontinued operations | — | 3.4 | — | 3.5 | |||||||||||
| Business combination expense - discontinued operations | — | — | — | 0.4 | |||||||||||
| (Gain) / loss on foreign currency exchanges | (1.2 | ) | 19.6 | (26.7 | ) | 25.8 | |||||||||
| Other (income) / expense, net - continuing operations(a) | (77.2 | ) | 2.5 | (133.9 | ) | 6.8 | |||||||||
| Other (income) / expense, net - discontinued operations(a) | (9.4 | ) | (0.1 | ) | 5.4 | (10.0 | ) | ||||||||
| Loss on remeasurement of notes receivable | — | 35.4 | 1.6 | 36.4 | |||||||||||
| (Gain) / loss on remeasurement of investment in nonconsolidated affiliates | (0.2 | ) | (0.1 | ) | 0.9 | (6.6 | ) | ||||||||
| Add: Preferred return to preferred OP units / equity interests | 3.1 | 3.2 | 12.6 | 12.8 | |||||||||||
| Add: Income / (loss) attributable to noncontrolling interests | 5.6 | (9.8 | ) | 56.4 | 5.3 | ||||||||||
| Add: Gain on dispositions of assets, net | 3.1 | 6.0 | 14.9 | 27.1 | |||||||||||
| Recurring EBITDA(a) | $ | 206.2 | $ | 271.5 | $ | 1,069.9 | $ | 1,224.0 | |||||||
(a) Refer to Definitions and Notes for additional information.
(b) Represents non-recurring transaction costs that are directly attributable to the Safe Harbor Sale.
Real Property Operations - Total Portfolio
($ in millions, Unaudited)
| Quarter Ended December 31, 2025 | Quarter Ended December 31, 2024 | ||||||||||||||||||||||||||||||
| MH | RV | UK | Total | MH | RV | UK | Total | ||||||||||||||||||||||||
| Revenues | |||||||||||||||||||||||||||||||
| Real property (excluding transient)(a) | $ | 259.3 | $ | 81.7 | $ | 35.1 | $ | 376.1 | $ | 239.1 | $ | 76.6 | $ | 33.4 | $ | 349.1 | |||||||||||||||
| Real property - transient | 0.2 | 31.7 | 5.5 | 37.4 | 0.3 | 33.4 | 5.0 | 38.7 | |||||||||||||||||||||||
| Total operating revenues | 259.5 | 113.4 | 40.6 | 413.5 | 239.4 | 110.0 | 38.4 | 387.8 | |||||||||||||||||||||||
| Expenses | |||||||||||||||||||||||||||||||
| Property operating expenses | 80.7 | 60.1 | 24.1 | 164.9 | 77.5 | 59.6 | 22.1 | 159.2 | |||||||||||||||||||||||
| Real Property NOI(a) | $ | 178.8 | $ | 53.3 | $ | 16.5 | $ | 248.6 | $ | 161.9 | $ | 50.4 | $ | 16.3 | $ | 228.6 | |||||||||||||||
| Year Ended December 31, 2025 | Year Ended December 31, 2024 | ||||||||||||||||||||||||||||||
| MH | RV | UK | Total | MH | RV | UK | Total | ||||||||||||||||||||||||
| Revenues | |||||||||||||||||||||||||||||||
| Real property (excluding transient)(a) | $ | 1,012.5 | $ | 337.2 | $ | 133.3 | $ | 1,483.0 | $ | 956.2 | $ | 318.8 | $ | 132.2 | $ | 1,407.2 | |||||||||||||||
| Real property - transient | 1.0 | 229.4 | 52.4 | 282.8 | 1.2 | 249.7 | 45.0 | 295.9 | |||||||||||||||||||||||
| Total operating revenues | 1,013.5 | 566.6 | 185.7 | 1,765.8 | 957.4 | 568.5 | 177.2 | 1,703.1 | |||||||||||||||||||||||
| Expenses | |||||||||||||||||||||||||||||||
| Property operating expenses | 321.8 | 280.2 | 105.0 | 707.0 | 314.1 | 275.6 | 98.1 | 687.8 | |||||||||||||||||||||||
| Real Property NOI | $ | 691.7 | $ | 286.4 | $ | 80.7 | $ | 1,058.8 | $ | 643.3 | $ | 292.9 | $ | 79.1 | $ | 1,015.3 | |||||||||||||||
| As of December 31, 2025 | As of December 31, 2024 | ||||||||||||||||||||||||||||||
| MH | RV | UK | Total | MH | RV | UK | Total | ||||||||||||||||||||||||
| Number of Properties | 294 | 166 | 53 | 513 | 287 | 167 | 53 | 507 | |||||||||||||||||||||||
| Sites | |||||||||||||||||||||||||||||||
| Sites(b) | 100,150 | 33,330 | 17,750 | 151,230 | 97,430 | 32,100 | 17,690 | 147,220 | |||||||||||||||||||||||
| Transient sites | N/A | 23,550 | 3,870 | 27,420 | N/A | 24,830 | 4,340 | 29,170 | |||||||||||||||||||||||
| Total | 100,150 | 56,880 | 21,620 | 178,650 | 97,430 | 56,930 | 22,030 | 176,390 | |||||||||||||||||||||||
| Occupancy | 97.2 | % | 100.0 | % | 89.1 | % | 96.9 | % | 97.3 | % | 100.0 | % | 89.7 | % | 97.0 | % | |||||||||||||||
N/A = Not applicable.
(a) Refer to Definitions and Notes for additional information.
(b) MH annual sites included 12,518 and 10,923 rental homes in the Company's rental program at December 31, 2025 and 2024, respectively. The Company's investment in occupied rental homes at December 31, 2025 was $921.3 million, an increase of 17.7% from $783.0 million at December 31, 2024.
Real Property Operations - North America Same Property Portfolio(a)
($ in millions, Unaudited)
| Quarter Ended December 31, 2025 | Quarter Ended December 31, 2024 | Total Change | % Change(b) | |||||||||||||||||||||||||||
| MH | RV | Total | MH | RV | Total | MH | RV | Total | ||||||||||||||||||||||
| Same Property Revenues | ||||||||||||||||||||||||||||||
| Real property (excluding transient) | $ | 235.7 | $ | 73.7 | $ | 309.4 | $ | 219.5 | $ | 69.2 | $ | 288.7 | $ | 20.7 | 7.3 | % | 6.4 | % | 7.1 | % | ||||||||||
| Real property - transient | 0.2 | 29.7 | 29.9 | 0.3 | 31.4 | 31.7 | (1.8 | ) | (21.0) % | (5.4) % | (5.6) % | |||||||||||||||||||
| Total Same Property operating revenues | 235.9 | 103.4 | 339.3 | 219.8 | 100.6 | 320.4 | 18.9 | 7.3 | % | 2.7 | % | 5.9 | % | |||||||||||||||||
| Same Property Expenses | ||||||||||||||||||||||||||||||
| Same Property operating expenses(a)(c) | 60.5 | 52.0 | 112.5 | 58.6 | 51.6 | 110.2 | 2.3 | 3.2 | % | 0.6 | % | 2.0 | % | |||||||||||||||||
| Real Property NOI(a) | $ | 175.4 | $ | 51.4 | $ | 226.8 | $ | 161.2 | $ | 49.0 | $ | 210.2 | $ | 16.6 | 8.8 | % | 5.0 | % | 7.9 | % | ||||||||||
| Year Ended December 31, 2025 | Year Ended December 31, 2024 | Total Change | % Change(b) | |||||||||||||||||||||||||||
| MH | RV | Total | MH | RV | Total | MH | RV | Total | ||||||||||||||||||||||
| Same Property Revenues | ||||||||||||||||||||||||||||||
| Real property (excluding transient) | $ | 927.4 | $ | 305.7 | $ | 1,233.1 | $ | 865.0 | $ | 284.4 | $ | 1,149.4 | $ | 83.7 | 7.2 | % | 7.5 | % | 7.3 | % | ||||||||||
| Real property - transient | 1.0 | 214.4 | 215.4 | 1.1 | 235.5 | 236.6 | (21.2 | ) | (13.7) % | (9.0) % | (9.0) % | |||||||||||||||||||
| Total Same Property operating revenues | 928.4 | 520.1 | 1,448.5 | 866.1 | 519.9 | 1,386.0 | 62.5 | 7.2 | % | — | % | 4.5 | % | |||||||||||||||||
| Same Property Expenses | ||||||||||||||||||||||||||||||
| Same Property operating expenses(a)(c) | 241.5 | 243.3 | 484.8 | 235.2 | 239.0 | 474.2 | 10.6 | 2.7 | % | 1.8 | % | 2.2 | % | |||||||||||||||||
| Real Property NOI(a) | $ | 686.9 | $ | 276.8 | $ | 963.7 | $ | 630.9 | $ | 280.9 | $ | 911.8 | $ | 51.9 | 8.9 | % | (1.4) % | 5.7 | % | |||||||||||
(a) Refer to Definitions and Notes for additional information.
(b) Percentages are calculated based on unrounded numbers.
(c) Total Same Property operating expenses consist of the following components for the periods shown (in millions) and exclude amounts invested into recently acquired properties to bring them up to the Company's standards:
| Quarter Ended December 31, | Year Ended December 31, | ||||||||||||||||||||||||
| 2025 | 2024 | Change | % Change(b) | 2025 | 2024 | Change | % Change(b) | ||||||||||||||||||
| Payroll and benefits | $ | 32.2 | $ | 30.4 | $ | 1.8 | 5.7 | % | $ | 141.2 | $ | 142.2 | $ | (1.0 | ) | (0.7) % | |||||||||
| Real estate taxes | 23.9 | 23.7 | 0.2 | 1.0 | % | 99.7 | 93.0 | 6.7 | 7.2 | % | |||||||||||||||
| Supplies and repairs | 18.7 | 19.0 | (0.3 | ) | (1.3) % | 76.3 | 74.3 | 2.0 | 2.8 | % | |||||||||||||||
| Utilities | 17.6 | 17.6 | — | — | % | 72.6 | 69.1 | 3.5 | 5.0 | % | |||||||||||||||
| Legal, state / local taxes, and insurance | 10.6 | 10.2 | 0.4 | 3.2 | % | 44.0 | 44.7 | (0.7 | ) | (1.6) % | |||||||||||||||
| Other | 9.5 | 9.3 | 0.2 | 1.8 | % | 51.0 | 50.9 | 0.1 | (0.3) % | ||||||||||||||||
| Total Same Property Operating Expenses | $ | 112.5 | $ | 110.2 | $ | 2.3 | 2.0 | % | $ | 484.8 | $ | 474.2 | $ | 10.6 | 2.2 | % | |||||||||
Real Property Operations - North America Same Property Portfolio (continued)
(Unaudited)
| As of December 31, | ||||||||||||||||
| 2025 | 2024 | |||||||||||||||
| MH | RV | MH | RV | |||||||||||||
| Number of properties(a)(b) | 280 | 156 | 280 | 156 | ||||||||||||
| Sites | ||||||||||||||||
| MH and annual RV sites | 96,460 | 31,430 | 96,680 | 31,010 | ||||||||||||
| Transient RV sites | N/A | 21,560 | N/A | 22,550 | ||||||||||||
| Total | 96,460 | 52,990 | 96,680 | 53,560 | ||||||||||||
| MH and Annual RV Occupancy | ||||||||||||||||
| Occupancy(c) | 98.1 | % | 100.0 | % | 97.5 | % | 100.0 | % | ||||||||
| Average monthly base rent per site | $ | 745 | $ | 682 | $ | 708 | $ | 652 | ||||||||
| % Change of monthly base rent(d) | 5.2 | % | 4.6 | % | N/A | N/A | ||||||||||
| Rental Program Statistics included in MH | ||||||||||||||||
| Number of occupied sites, end of period(e) | 11,930 | N/A | 10,780 | N/A | ||||||||||||
| Monthly rent per site – MH rental program | $ | 1,384 | N/A | $ | 1,346 | N/A | ||||||||||
| % Change(d) | 2.8 | % | N/A | N/A | N/A | |||||||||||
N/A = Not applicable.
(a) Same Property results include one MH property that was sold on December 30, 2025 and therefore excluded from the property count above.
(b) Financial results from properties impacted by dispositions and catastrophic weather events during 2025 have been removed from Same Property reporting.
(c) Same Property blended occupancy for MH and RV was 98.6% at December 31, 2025, up 50 basis points from 98.1% at December 31, 2024. Adjusting for recently delivered and vacant expansion sites, Same Property adjusted blended occupancy for MH and RV increased by 40 basis points year over year, to 99.1% at December 31, 2025, from 98.7% at December 31, 2024.
(d) Calculated using actual results without rounding.
(e) Occupied rental program sites in Same Property are included in total sites.
Real Property Operations - UK Same Property Portfolio(a)
($ in millions, except for statistical information, Unaudited)
| Quarter Ended December 31, | Year Ended December 31, | ||||||||||||||||
| 2025 | 2024 | % Change(c) | 2025 | 2024 | % Change(c) | ||||||||||||
| Same Property Revenues | |||||||||||||||||
| Real property (excluding transient) | $ | 28.9 | $ | 27.8 | 4.0 | % | $ | 109.9 | $ | 105.7 | 4.1 | % | |||||
| Real property - transient | 5.2 | 5.1 | 2.3 | % | 50.0 | 46.6 | 7.1 | % | |||||||||
| Total Same Property operating revenues | 34.1 | 32.9 | 3.7 | % | 159.9 | 152.3 | 5.0 | % | |||||||||
| Same Property Expenses | |||||||||||||||||
| Same Property operating expenses(a) | 17.7 | 16.0 | 10.4 | % | 78.3 | 73.4 | 6.6 | % | |||||||||
| Real Property NOI(a)(b) | $ | 16.4 | $ | 16.9 | (2.6) % | $ | 81.6 | $ | 78.9 | 3.5 | % | ||||||
| As of December 31, | ||||||||
| 2025 | 2024 | |||||||
| Number of properties | 51 | 51 | ||||||
| Sites | ||||||||
| UK sites | 16,910 | 16,980 | ||||||
| UK transient sites | 3,270 | 3,380 | ||||||
| Occupancy(d) | 89.2 | % | 89.7 | % | ||||
| Average monthly base rent per site | $ | 585 | $ | 562 | ||||
| % change in monthly base rent(c) | 4.1 | % | N/A | |||||
(a) Refer to Definitions and Notes for additional information.
(b) Same Property results for the Company's UK properties reflect constant currency for comparative purposes. British pound sterling figures in the prior comparative period have been translated at the average exchange rate of $1.3298 and $1.3183 USD per pound sterling, respectively, during the quarter and year ended December 31, 2025. Prior to constant currency adjustments, UK Same Property NOI increased by 0.7% and 7.3% during the quarter and year ended December 31, 2025, respectively.
(c) Percentages are calculated based on unrounded numbers.
(d) Adjusting for recently delivered and vacant expansion sites, Same Property adjusted occupancy decreased by 30 basis points year over year, to 89.7% at December 31, 2025, from 90.0% at December 31, 2024.
Home Sales Summary
($ in millions, except for average selling price, Unaudited)
| Quarter Ended December 31, | Year Ended December 31, | ||||||||||||||||||||
| 2025 | 2024 | % Change | 2025 | 2024 | % Change | ||||||||||||||||
| Financial Information | |||||||||||||||||||||
| North America | |||||||||||||||||||||
| Home sales | $ | 32.1 | $ | 43.1 | (25.5) % | $ | 140.4 | $ | 181.1 | (22.5) % | |||||||||||
| Home cost and selling expenses | 29.8 | 36.3 | (17.9) % | 120.1 | 145.7 | (17.6) % | |||||||||||||||
| NOI(a) | $ | 2.3 | $ | 6.8 | (66.2) % | $ | 20.3 | $ | 35.4 | (42.7) % | |||||||||||
| NOI margin %(a) | 7.2 | % | 15.8 | % | 14.5 | % | 19.5 | % | |||||||||||||
| UK | |||||||||||||||||||||
| Home sales | $ | 38.8 | $ | 45.1 | (14.0) % | $ | 193.4 | $ | 188.8 | 2.4 | % | ||||||||||
| Home cost and selling expenses | 33.5 | 33.8 | (0.9) % | 143.7 | 127.4 | 12.8 | % | ||||||||||||||
| NOI(a) | $ | 5.3 | $ | 11.3 | (53.1) % | $ | 49.7 | $ | 61.4 | (19.1) % | |||||||||||
| NOI margin %(a) | 13.7 | % | 25.1 | % | 25.7 | % | 32.5 | % | |||||||||||||
| Total | |||||||||||||||||||||
| Home sales | $ | 70.9 | $ | 88.2 | (19.6) % | $ | 333.8 | $ | 369.9 | (9.8) % | |||||||||||
| Home cost and selling expenses | 63.3 | 70.1 | (9.7) % | 263.8 | 273.1 | (3.4) % | |||||||||||||||
| NOI(a) | $ | 7.6 | $ | 18.1 | (58.0) % | $ | 70.0 | $ | 96.8 | (27.7) % | |||||||||||
| NOI margin %(a) | 10.7 | % | 20.5 | % | 21.0 | % | 26.2 | % | |||||||||||||
| Other information | |||||||||||||||||||||
| Units Sold: | |||||||||||||||||||||
| North America | 333 | 494 | (32.6) % | 1,564 | 2,001 | (21.8) % | |||||||||||||||
| UK | 556 | 604 | (7.9) % | 2,803 | 2,948 | (4.9) % | |||||||||||||||
| Total home sales | 889 | 1,098 | (19.0) % | 4,367 | 4,949 | (11.8) % | |||||||||||||||
| Average Selling Price: | |||||||||||||||||||||
| North America | $ | 96,396 | $ | 87,247 | 10.5 | % | $ | 89,770 | $ | 90,505 | (0.8) % | ||||||||||
| UK | $ | 69,784 | $ | 74,669 | (6.5) % | $ | 68,998 | $ | 64,043 | 7.7 | % | ||||||||||
(a) Refer to Definitions and Notes for additional information.
Operating Statistics for MH and Annual RVs
| Resident Move-outs | |||||||||||||
| % of Total Sites | Number of Move-outs | Leased Sites, Net(a) | New Home Sales | Pre-owned Home Sales | Brokered Re-sales | ||||||||
| 2025 | 6.2 | % | 10,179 | 1,138 | 354 | 1,210 | 1,646 | ||||||
| 2024 | 4.3 | % | 7,050 | 3,209 | 447 | 1,554 | 1,700 | ||||||
| 2023 | 3.6 | % | 6,590 | 3,268 | 564 | 2,001 | 2,296 | ||||||
(a) Increase in revenue producing sites, net of new vacancies.
Acquisitions and Dispositions
($ in millions, Unaudited)
| Property Name | Property Type | Number of Properties | Sites | State, Province, or Country | Total Purchase Price / Sales Proceeds | Month | |||||||
| ACQUISITIONS | |||||||||||||
| Fourth Quarter 2025 | |||||||||||||
| Five MH / Two RV Portfolio | MH / RV | 7 | 1,193 | Various | $ | 175.2 | October | ||||||
| Three MH Portfolio | MH | 3 | 936 | MI | 100.3 | October | |||||||
| Marysville Farm | MH | 1 | 185 | MI | 20.5 | October | |||||||
| Reflections on Silver Lake | MH / RV | 1 | 593 | FL | 70.0 | October | |||||||
| Lakeridge of Eugene | MH | 1 | 192 | OR | 31.0 | October | |||||||
| The Preserve | MH | 1 | 506 | FL | 60.0 | October | |||||||
| Subsequent to Fourth Quarter 2025 | |||||||||||||
| Parkhurst Estates | MH | 1 | 279 | MI | 17.0 | January | |||||||
| Acquisitions to Date | 15 | 3,884 | $ | 474.0 | |||||||||
| DISPOSITIONS | |||||||||||||
| First Quarter 2025 | |||||||||||||
| RV Portfolio(a) | RV | 2 | 815 | Various | $ | 92.9 | January | ||||||
| MH Portfolio | MH | 3 | 136 | FL | 27.8 | March | |||||||
| Second Quarter 2025 | |||||||||||||
| Sun Retreats Millbrook | RV | 1 | 394 | IL | 3.5 | April | |||||||
| Safe Harbor Marinas - Initial Closing | Marina | 123 | 43,143 | Various | 5,250.0 | April | |||||||
| Safe Harbor Marinas - Delayed Consent Subsidiaries | Marina | 6 | 1,770 | Various | 136.7 | May / June | |||||||
| Third Quarter 2025 | |||||||||||||
| Safe Harbor Marinas - Delayed Consent Subsidiaries | Marina | 9 | 3,880 | Various | 117.5 | August | |||||||
| Fourth Quarter 2025 | |||||||||||||
| Pine Hills | MH | 1 | 130 | IN | 10.3 | December | |||||||
| Total Dispositions to Date | 145 | 50,268 | $ | 5,638.7 | |||||||||
(a) Total sales proceeds include the disposition of two operating properties and two development properties that were owned by the Company along with the settlement of a developer note receivable of $36.5 million pertaining to three additional properties in which the Company had provided financing to the developer.
Capital Expenditures and Investments(a)
($ in millions, Unaudited)
| Year Ended December 31, | ||||||||||||||||||||||||||
| 2025 | 2024 | 2023 | ||||||||||||||||||||||||
| MH / RV | UK | Total | MH / RV | UK | Total | MH / RV | UK | Total | ||||||||||||||||||
| Recurring Capital Expenditures(b) | $ | 55.8 | $ | 14.0 | $ | 69.8 | $ | 54.5 | $ | 13.5 | $ | 68.0 | $ | 51.8 | $ | — | $ | 51.8 | ||||||||
| Non-Recurring Capital Expenditures(b) | ||||||||||||||||||||||||||
| Lot Modifications | $ | 38.8 | $ | 1.3 | $ | 40.1 | $ | 35.5 | $ | 1.7 | $ | 37.2 | $ | 54.9 | $ | — | $ | 54.9 | ||||||||
| Growth Projects | 12.9 | 1.9 | 14.8 | 11.5 | 4.8 | 16.3 | 21.6 | — | 21.6 | |||||||||||||||||
| Rebranding | — | 0.5 | 0.5 | — | 3.1 | 3.1 | 4.7 | — | 4.7 | |||||||||||||||||
| Acquisitions | 469.7 | 9.3 | 479.0 | 36.2 | 13.5 | 49.7 | 115.1 | 67.3 | 182.4 | |||||||||||||||||
| Expansion and Development | 66.7 | 33.9 | 100.6 | 105.2 | 17.8 | 123.0 | 247.4 | 2.9 | 250.3 | |||||||||||||||||
| Total Non-Recurring Capital Expenditures | 588.1 | 46.9 | 635.0 | 188.4 | 40.9 | 229.3 | 443.7 | 70.2 | 513.9 | |||||||||||||||||
| Total | $ | 643.9 | $ | 60.9 | $ | 704.8 | $ | 242.9 | $ | 54.4 | $ | 297.3 | $ | 495.5 | $ | 70.2 | $ | 565.7 | ||||||||
(a) Represents capital expenditures and investments related to the Company's continuing operations and excludes activity related to Safe Harbor Marinas, which is classified within discontinued operations.
(b) Refer to Definitions and Notes for additional information.
Capitalization Overview
(Shares and units in thousands, $ in millions, except for *, Unaudited)
| As of December 31, 2025 | |||||||||
| Common Equivalent Shares | Share Price* | Capitalization | |||||||
| Equity and Enterprise Value | |||||||||
| Common shares | 123,487 | $ | 123.91 | $ | 15,301.3 | ||||
| Convertible securities | |||||||||
| Common OP units | 2,637 | $ | 123.91 | 326.7 | |||||
| Preferred OP units | 2,393 | $ | 123.91 | 296.5 | |||||
| Diluted shares outstanding and market capitalization(a) | 128,517 | 15,924.5 | |||||||
| Plus: Total debt, per consolidated balance sheet | 4,258.7 | ||||||||
| Total capitalization | 20,183.2 | ||||||||
| Less: Cash and cash equivalents (excluding restricted cash) - continuing operations | (569.6 | ) | |||||||
| Enterprise Value(a) | $ | 19,613.6 | |||||||
(a) Refer to Definitions and Notes for additional information related to the Company's securities outstanding.
(b)
| As of December 31, 2025 | |||||||||
| Debt Outstanding | Weighted Average Interest Rate(a) | Weighted Average Maturity (in years) | Maturity Date | ||||||
| Secured Debt: | |||||||||
| Mortgage loans payable | $ | 2,429.0 | 3.63 | % | 8.5 | Various | |||
| Secured borrowings on collateralized receivables(b) | 43.2 | 8.54 | % | 12.3 | Various | ||||
| Total Secured Debt | 2,472.2 | 3.72 | % | ||||||
| Unsecured Debt: | |||||||||
| Senior Unsecured Notes: | |||||||||
| 2028 senior unsecured notes | 448.1 | 2.29 | % | 2.8 | November 2028 | ||||
| 2031 senior unsecured notes | 744.3 | 2.70 | % | 5.5 | July 2031 | ||||
| 2032 senior unsecured notes | 594.1 | 3.61 | % | 6.3 | April 2032 | ||||
| Total Unsecured Debt | 1,786.5 | 2.90 | % | 5.1 | |||||
| Total carrying value of debt, per consolidated balance sheets | 4,258.7 | 3.38 | % | 7.1 | |||||
| Plus: Unamortized deferred financing costs, discounts / premiums on debt, and fair value adjustments(a) | 19.3 | ||||||||
| Total debt | $ | 4,278.0 | |||||||
(a) Includes the effect of amortizing deferred financing costs, unsecured note discounts, and fair value adjustments on the Secured borrowings on collateralized receivables.
(b) Refer to Definitions and Notes for additional information.
(c)
Debt Maturities(a)
($ in millions, Unaudited)
| As of December 31, 2025 | |||||||||||||||
| Year | Mortgage Loans Payable(b) | Principal Amortization | Secured Borrowings on Collateralized Receivables(c)(d) | Senior Unsecured Notes | Total | ||||||||||
| 2026 | $ | 492.0 | $ | 40.6 | $ | 2.2 | $ | — | $ | 534.8 | |||||
| 2027 | — | 34.9 | 2.4 | — | 37.3 | ||||||||||
| 2028 | 175.7 | 38.8 | 2.5 | 450.0 | 667.0 | ||||||||||
| 2029 | 310.7 | 38.2 | 2.7 | — | 351.6 | ||||||||||
| 2030 | 7.5 | 37.4 | 3.0 | — | 47.9 | ||||||||||
| Thereafter | 808.3 | 454.5 | 26.6 | 1,350.0 | 2,639.4 | ||||||||||
| Total | $ | 1,794.2 | $ | 644.4 | $ | 39.4 | $ | 1,800.0 | $ | 4,278.0 | |||||
(a) Debt maturities include the unamortized deferred financing costs, discount / premiums, and fair value adjustments associated with outstanding debt.
(b) For the Mortgage loans payable maturing between 2026 - 2030:
| 2026 | 2027 | 2028 | 2029 | 2030 | ||||||||||
| Weighted average interest rate | 3.76 | % | — | % | 3.97 | % | 3.16 | % | 3.45 | % |
(c) Balance at December 31, 2025 excludes fair value adjustments of $3.8 million.
(d) Refer to Definitions and Notes for additional information.
Debt Analysis
(Unaudited)
| As of December 31, 2025 | |||||
| Select Credit Ratios | |||||
| Net Debt / TTM Recurring EBITDA(a) | 3.4 x | ||||
| Net Debt / Enterprise Value(a) | 18.8 | % | |||
| Net Debt / Gross Assets(a) | 22.8 | % | |||
| Unencumbered Assets / Total Assets | 79.6 | % | |||
| Floating rate debt / total debt | N/A(c) | ||||
| Coverage Ratios | |||||
| TTM Recurring EBITDA(a)(b) / Interest | 4.9 x | ||||
| TTM Recurring EBITDA(a)(b) / Interest + Preferred distributions + Preferred stock distribution | 4.9 x | ||||
| Credit Facility Covenants(d) | Requirement | ||||
| Maximum leverage ratio | <65.0 % | 18.6 | % | ||
| Minimum fixed charge coverage ratio | >1.40 x | 3.66 x | |||
| Maximum secured leverage ratio | <40.0 % | 10.3 | % | ||
| Senior Unsecured Note Covenants | Requirement | ||||
| Total debt / Total assets | ≤60.0 % | 27.0 | % | ||
| Secured debt / Total assets | ≤40.0 % | 15.6 | % | ||
| Consolidated income available for debt service / Debt service | ≥1.50 x | 6.95 x | |||
| Unencumbered total asset value / Total unsecured debt | ≥150.0 % | 700.7 | % | ||
(a) Refer to Definitions and Notes for additional information.
(b) Percentage includes the impact of hedge activities.
(c) As of December 31, 2025, the Company has no floating rate debt.
(d) As of December 31, 2025, the Company did not have any borrowings outstanding under its senior credit facility.
Definitions and Notes
(Unaudited)
Acquisition and Other Transaction Costs - In the Company's Reconciliation of Net Income / (Loss) Attributable to SUI Common Shareholders to Core FFO on page 5, 'Acquisition and other transaction costs - continuing operations' represent (a) nonrecurring integration expenses associated with acquisitions during the quarter and year ended December 31, 2025 and 2024, (b) costs associated with potential acquisitions that will not close, (c) expenses incurred to bring recently acquired properties up to the Company's operating standards, including items such as tree trimming and painting costs that do not meet the Company's capitalization policy, and (d) other non-recurring transaction costs. Within this same reconciliation on page 5, 'Acquisition and other transaction costs - discontinued operations' primarily represent non-recurring transaction costs that are directly attributable to the Safe Harbor Sale and nonrecurring integration expenses associated with previous marina acquisitions.
Asset Impairments - In the Company's Consolidated Statements of Operations on page 4, the Company recorded asset impairment charges of $30.7 million for the quarter ended December 31, 2025, primarily consisting of charges to reduce the carrying value of three properties in the UK, driven by a contemplated change in strategic plan for the properties.
Discontinued Operations - In February 2025, the Company entered into the Safe Harbor Sale, which represents a strategic shift in operations that is expected to have a major effect on the Company's operations and financial results. Accordingly, the results of the Marina business and assets and liabilities included in the disposition are presented as held for sale and as discontinued operations for all periods presented herein.
During the quarter ended June 30, 2025, the Company completed the initial closing of the Safe Harbor Sale, which generated pre-tax proceeds of approximately $5.25 billion, net of transaction costs. The subsequent closing of the transfer of 15 Delayed Consent Subsidiaries with an aggregate agreed value of approximately $250.0 million was further subject to the receipt of certain third-party consents. Subsequent to the initial closing through June 30, 2025, the Company completed the sale of six Delayed Consent Subsidiaries for $136.7 million. In connection with the closings of the Safe Harbor Sale and the initial six Delayed Consent Subsidiaries, the Company recorded a gain on sale of $1.4 billion within Income from discontinued operations, net during the quarter ended June 30, 2025. During the quarter ended September 30, 2025, the Company completed the sale of the remaining nine Delayed Consent Subsidiaries for $117.5 million and recorded a gain on sale of $15.4 million. As a result, as of September 30, 2025, the Company has fully divested its investment in the Safe Harbor business.
The following table sets forth a summary of the operating results included within Income from discontinued operations, net related to Safe Harbor Marinas (in millions):
| Quarter Ended December 31, | Year Ended December 31, | ||||||||||||||
| 2025 | 2024 | 2025 | 2024 | ||||||||||||
| Revenues | |||||||||||||||
| Real property | $ | — | $ | 113.2 | $ | 145.9 | $ | 460.3 | |||||||
| Service, retail, dining and entertainment | — | 116.6 | 164.7 | 494.4 | |||||||||||
| Interest, brokerage commissions and other, net | — | 1.5 | 1.6 | 5.9 | |||||||||||
| Total Revenues | — | 231.3 | 312.2 | 960.6 | |||||||||||
| Expenses | |||||||||||||||
| Property operating and maintenance | — | 37.5 | 53.6 | 148.3 | |||||||||||
| Real estate tax | — | 5.3 | 7.9 | 21.9 | |||||||||||
| Service, retail, dining and entertainment | — | 107.6 | 155.4 | 461.8 | |||||||||||
| General and administrative(1) | — | 16.5 | 81.2 | 64.8 | |||||||||||
| Interest expense | — | — | — | 0.1 | |||||||||||
| Catastrophic event-related charges, net | — | 3.4 | — | 3.5 | |||||||||||
| Business combination costs | — | — | 0.2 | 0.4 | |||||||||||
| Depreciation, amortization, and loss on disposal of assets | — | 47.8 | 36.3 | 190.2 | |||||||||||
| Asset impairments | — | 2.6 | 2.3 | 4.7 | |||||||||||
| Total Expenses | — | 220.7 | 336.9 | 895.7 | |||||||||||
| Loss Before Other Items | — | 10.6 | (24.7 | ) | 64.9 | ||||||||||
| Gain on disposition of properties, net | 2.8 | — | 1,463.2 | — | |||||||||||
| Other income / (expense), net(2) | 9.4 | 0.1 | (5.4 | ) | 10.0 | ||||||||||
| Income from discontinued operations, before income taxes | 12.2 | 10.7 | 1,433.1 | 74.9 | |||||||||||
| Current tax expense | (1.2 | ) | (0.2 | ) | (3.5 | ) | (0.7 | ) | |||||||
| Income from discontinued operations, net | $ | 11.0 | $ | 10.5 | $ | 1,429.6 | $ | 74.2 | |||||||
(1) Includes transaction costs associated with the Safe Harbor Sale of $63.1 million during the year ended December 31, 2025, including legal and advisory fees, employee separation costs, and other costs.
(2) During the quarter ended March 31, 2025, the Company recorded contingent consideration expense of $14.6 million related to a tax protection agreement that the Company entered into with former owners of certain Marina properties at the time of acquisition. The tax protection agreement stipulates that the Company indemnify those owners for certain tax obligations incurred related to the sale of certain Marina properties. As a result of the Safe Harbor Sale, the Company concluded that our tax liability to the former owners was probable of being realized and estimable. During the quarter ended December 31, 2025, the Company recorded a benefit of $9.4 million after completing its 1031 exchange transactions using proceeds from the Safe Harbor Sale and remeasuring the remaining tax liability to a fair value of $0.
Capital Expenditures and Investment Activity - The Company classifies its investments in properties into the following categories:
Capital improvements subsequent to acquisition often require 24 to 36 months to complete after closing. At MH, RV, and UK properties, capital improvements include upgrading clubhouses; landscaping; new street lighting systems; new mail delivery systems; pool renovations including larger decks, heaters and furniture; new maintenance facilities; lot modifications; and new signage including main signs and internal road signs.
For the year ended December 31, 2025, the components of total acquisition investment are as follows, excluding discontinued operations (in millions):
| Year Ended December 31, 2025 | |||||||||
| MH / RV | UK | Total | |||||||
| Purchase price of property acquisitions (including capitalized transaction costs) | $ | 457.4 | $ | — | $ | 457.4 | |||
| Purchase price of land acquisitions (including capitalized transaction costs) | — | 2.5 | 2.5 | ||||||
| Capital improvements to recent property acquisitions | 8.3 | 6.8 | 15.1 | ||||||
| Other acquisitions | 4.0 | — | 4.0 | ||||||
| Total acquisition investments | $ | 469.7 | $ | 9.3 | $ | 479.0 | |||
Cash, Cash Equivalents and Restricted Cash - Includes cash and cash equivalents of $66.5 million as of December 31, 2025, that was held in escrow accounts and restricted from general use. The restricted cash and cash equivalents include $57.2 million that has been designated to fund potential future MH and RV acquisitions under 1031 exchange transactions.
Enterprise Value - Equals total equity market capitalization, plus total indebtedness reported on the Company's balance sheet and less unrestricted cash and cash equivalents.
GAAP - U.S. Generally Accepted Accounting Principles.
Home Sales Contribution to FFO - The reconciliation of NOI from home sales to FFO from home sales for the quarter and year ended December 31, 2025 is as follows (in millions):
| Quarter Ended December 31, 2025 | Year Ended December 31, 2025 | ||||||||||||||||||||||
| MH | UK | Total | MH | UK | Total | ||||||||||||||||||
| Home Sales NOI | $ | 2.3 | $ | 5.3 | $ | 7.6 | $ | 20.3 | $ | 49.7 | $ | 70.0 | |||||||||||
| Gain on dispositions of assets, net | (2.7 | ) | (0.4 | ) | (3.1 | ) | (13.7 | ) | (1.2 | ) | (14.9 | ) | |||||||||||
| FFO contribution from home sales | $ | (0.4 | ) | $ | 4.9 | $ | 4.5 | $ | 6.6 | $ | 48.5 | $ | 55.1 | ||||||||||
Interest expense - The following is a summary of the components of the Company's interest expense (in millions):
| Quarter Ended December 31, | Year Ended December 31, | ||||||||||||||
| 2025 | 2024 | 2025 | 2024 | ||||||||||||
| Interest on secured debt, senior unsecured notes, senior credit facility, unsecured term loan, and interest rate swaps | $ | 36.2 | $ | 76.0 | $ | 200.0 | $ | 324.8 | |||||||
| Lease related interest expense | 0.8 | 3.6 | 10.1 | 14.3 | |||||||||||
| Amortization of deferred financing costs, debt (premium) / discounts, and (gains) / losses on hedges | 0.8 | 1.6 | 4.6 | 6.6 | |||||||||||
| Senior credit facility commitment fees and other finance related charges | 1.0 | 2.5 | 5.8 | 8.4 | |||||||||||
| Capitalized interest expense | (0.6 | ) | (1.7 | ) | (3.5 | ) | (8.5 | ) | |||||||
| Interest expense before interest on secured borrowings | 38.2 | 82.0 | 217.0 | 345.6 | |||||||||||
| Interest expense on secured borrowings on collateralized receivables | 1.0 | 1.2 | 4.0 | 4.7 | |||||||||||
| Interest expense, per Consolidated Statements of Operations | $ | 39.2 | $ | 83.2 | $ | 221.0 | $ | 350.3 | |||||||
Loss of earnings - catastrophic event-related charges, net - include the following (in millions):
| Quarter Ended December 31, | Year Ended December 31, | |||||||||||||
| 2025 | 2024 | 2025 | 2024 | |||||||||||
| Hurricane Ian - Estimated loss of earnings in excess of the applicable business interruption deductible | $ | — | $ | 4.0 | $ | 12.0 | $ | 19.2 | ||||||
| Hurricane Ian - Insurance recoveries realized for previously estimated loss of earnings | — | (11.3 | ) | (9.9 | ) | (16.3 | ) | |||||||
| Hurricane Ian - Recognition of deferred lump sum insurance settlement(1) | 3.1 | — | 3.1 | — | ||||||||||
| Other catastrophic weather event - Estimated loss of earnings in excess of the applicable business interruption deductible, net | — | 0.5 | 0.4 | 1.8 | ||||||||||
| Other catastrophic weather event - insurance recoveries realized for previously estimated loss of earnings | — | (1.3 | ) | — | (1.3 | ) | ||||||||
| Loss of earnings - catastrophic event-related charges, net | $ | 3.1 | $ | (8.1 | ) | $ | 5.6 | $ | 3.4 | |||||
(1) During the quarter ended December 31, 2025, the Company received a settlement of $80.2 million from an insurance provider to settle all claims related to property, casualty, flood, and business interruption insurance recoveries from Hurricane Ian. The Company concluded that $36.5 million of the total settlement pertained to business interruption recoveries through 2027, which the Company recorded as a contingent gain per ASC 450. To better reflect the underlying economics of the transaction, the Company has elected to defer the business interruption recovery gain and recognize income ratably through 2027 for our presentation of Core FFO.
NAREIT - The National Association of Real Estate Investment Trusts is the worldwide representative voice for REITs and real estate companies with an interest in U.S. real estate and capital markets. More information is available at www.reit.com.
Net Debt - The carrying value of debt, plus, unamortized premiums, discounts, and deferred financing costs, less unrestricted cash and cash equivalents.
Other income / (expense), net - In the Company's Consolidated Statements of Operations on page 4, Other income / (expense), net consists of the following (in millions):
| Quarter Ended December 31, | Year Ended December 31, | ||||||||||||
| 2025 | 2024 | 2025 | 2024 | ||||||||||
| Gain on insurance settlement | $ | 68.5 | $ | — | $ | 68.5 | $ | — | |||||
| Cash flow hedge gains from debt extinguishments | 1.1 | — | 8.7 | — | |||||||||
| Long term lease termination gains / (losses) | 7.3 | (0.1 | ) | 51.4 | (1.3 | ) | |||||||
| Other | 0.3 | (2.4 | ) | 5.3 | (5.5 | ) | |||||||
| Other income / (expense), net | $ | 77.2 | $ | (2.5 | ) | $ | 133.9 | $ | (6.8 | ) | |||
Safe Harbor Sale - The Company's sale of Safe Harbor Marinas, LLC in 2025.
Same Property - The Company defines Same Properties as those the Company has owned and operated continuously since at least January 1, 2024. Same properties exclude ground-up development properties, acquired properties, properties classified as discontinued operations, properties impacted by catastrophic weather events, and properties sold after December 31, 2023. The Same Property data may change from time-to-time depending on acquisitions, dispositions, management discretion, significant transactions, or unique situations.
Secured borrowings on collateralized receivables - This is a transferred asset transaction which has been classified as collateralized receivables and the cash received from this transaction has been classified as secured borrowings. The interest income and interest expense accrue in equal amounts. The Company has elected to record the collateralized receivables and secured borrowings at fair value under ASC 820, "Fair Value Measurements and Disclosures." As a result, the balance of collateralized receivables and related secured borrowings are net of fair value adjustments.
Securities - The Company had the following securities outstanding as of December 31, 2025:
| Number of Units / Shares Outstanding (in thousands) | Conversion Rate(a) | If Converted to Common shares (in thousands)(b) | Issuance Price Per Unit | Annual Distribution Rate | |||||||
| Non-Convertible Securities | |||||||||||
| Common shares | 123,487 | N/A | N/A | N/A | $4.16(c) | ||||||
| Convertible Securities Classified as Equity | |||||||||||
| Common OP units | 2,637 | 1.0000 | 2,637 | N/A | $4.16(c) | ||||||
| Preferred OP Units | |||||||||||
| Series A-1 | 171 | 2.4390 | 414 | $ | 100.00 | 6.00 | % | ||||
| Series A-3 | 40 | 1.8605 | 75 | $ | 100.00 | 4.50 | % | ||||
| Series C | 292 | 1.1100 | 325 | $ | 100.00 | 5.00 | % | ||||
| Series D | 489 | 0.8000 | 391 | $ | 100.00 | 4.00 | % | ||||
| Series E | 80 | 0.6897 | 55 | $ | 100.00 | 5.50 | % | ||||
| Series F | 70 | 0.6250 | 44 | $ | 100.00 | 3.00 | % | ||||
| Series G | 5 | 0.6452 | 3 | $ | 100.00 | 3.20 | % | ||||
| Series H | 561 | 0.6098 | 342 | $ | 100.00 | 3.00 | % | ||||
| Series J | 236 | 0.6061 | 143 | $ | 100.00 | 2.85 | % | ||||
| Series K | 1,000 | 0.5882 | 588 | $ | 100.00 | 4.00 | % | ||||
| Series L | 20 | 0.6250 | 13 | $ | 100.00 | 3.50 | % | ||||
| Total | 2,964 | 2,393 | |||||||||
| Total Convertible Securities Outstanding | 5,601 | 5,030 | |||||||||
(a) Exchange rates are subject to adjustment upon stock splits, recapitalizations, and similar events. The exchange rates of certain series of OP units are approximated to four decimal places.
(b) Calculation may yield minor differences due to fractional shares paid in cash to the shareholder at conversion.
(c) Annual distribution is based on the last quarterly distribution annualized.
Share - In addition to reporting net income on a diluted basis ("EPS"), the Company reports FFO and Core FFO on a per common share and convertible securities basis (per "Share"). For the periods presented below, the Company's diluted weighted average common shares outstanding for EPS and FFO are as follows:
| Quarter Ended December 31, | Year Ended December 31, | ||||||
| 2025 | 2024 | 2025 | 2024 | ||||
| Diluted Weighted Average Common Shares Outstanding - EPS | |||||||
| Weighted average common shares outstanding - Basic | 122.8 | 126.5 | 124.9 | 124.5 | |||
| Dilutive restricted stock | — | 0.3 | — | — | |||
| Common and preferred OP units dilutive effect | — | 2.9 | — | 2.7 | |||
| Weighted Average Common Shares Outstanding - Diluted | 122.8 | 129.7 | 124.9 | 127.2 | |||
| Diluted Weighted Average Common Shares Outstanding - FFO | |||||||
| Weighted average common shares outstanding - Basic | 122.8 | 126.5 | 124.9 | 124.5 | |||
| Restricted stock | 0.3 | 0.3 | 0.5 | 0.3 | |||
| Common OP units | 2.8 | 2.9 | 2.8 | 2.8 | |||
| Common stock issuable upon conversion of certain preferred OP units | 2.3 | 2.6 | 2.5 | 2.6 | |||
| Weighted Average Common Shares and OP Units Outstanding | 128.2 | 132.3 | 130.7 | 130.2 | |||
UK Same Property Portfolio - Constant Currency Reconciliation
| Quarter Ended December 31, | Year Ended December 31, | ||||||||||||||||
| 2025 | 2024 | % Change | 2025 | 2024 | % Change | ||||||||||||
| Real Property NOI - Pre-Constant Currency Adjustments | $ | 16.4 | $ | 16.3 | 0.7 | % | $ | 81.6 | $ | 76.0 | 7.3 | % | |||||
| Real Property NOI impact of holding 2024 exchange rates constant | — | 0.6 | N/M | — | 2.9 | N/M | |||||||||||
| Real Property NOI | $ | 16.4 | $ | 16.9 | (2.6) % | $ | 81.6 | $ | 78.9 | 3.5 | % | ||||||
N/M = Not meaningful.
Utility Revenues - In its Consolidated Statements of Operations and its total portfolio presentation of real property operating results, the Company includes the following utility reimbursement revenues in real property revenues (excluding transient) (in millions):
| Quarter Ended December 31, | Year Ended December 31, | ||||||||||
| Consolidated Portfolio | 2025 | 2024 | 2025 | 2024 | |||||||
| Utility reimbursement revenues | |||||||||||
| MH | $ | 18.7 | $ | 18.1 | $ | 76.0 | $ | 72.5 | |||
| RV | 3.9 | 4.0 | 20.3 | 19.4 | |||||||
| UK | 5.5 | 5.1 | 20.9 | 18.6 | |||||||
| Total | $ | 28.1 | $ | 27.2 | $ | 117.2 | $ | 110.5 | |||
For its presentation of Same Property results on page 9 and page 11, the Company nets the following utility revenues (which include utility reimbursement revenues from residents) against related utility expenses in Same Property operating expenses (in millions):
| Quarter Ended December 31, | Year Ended December 31, | ||||||||||
| Same Property Portfolio | 2025 | 2024 | 2025 | 2024 | |||||||
| Utility revenues netted against related utility expenses | |||||||||||
| MH | $ | 18.4 | $ | 18.0 | $ | 75.3 | $ | 71.5 | |||
| RV | 3.8 | 4.0 | 20.2 | 19.0 | |||||||
| UK | 5.3 | 5.3 | 20.3 | 18.5 | |||||||
| Total | $ | 27.5 | $ | 27.3 | $ | 115.8 | $ | 109.0 | |||
Non-GAAP Supplemental Measures
Investors and analysts following the real estate industry use non-GAAP supplemental performance measures, including net operating income ("NOI"), earnings before interest, tax, depreciation, and amortization ("EBITDA") and funds from operations ("FFO") to assess REITs. The Company believes that NOI, EBITDA, and FFO are appropriate measures given their wide use by and relevance to investors and analysts. Additionally, NOI, EBITDA, and FFO are commonly used in various ratios, pricing multiples, yields and returns and valuation calculations used to measure financial position, performance, and value.
NOI provides a measure of rental operations and does not factor in depreciation, amortization and non-property specific expenses such as general and administrative expenses.
EBITDA provides a further measure to evaluate the Company's ability to incur and service debt; EBITDA also provides further measures to evaluate the Company's ability to fund dividends and other cash needs. FFO, reflecting the assumption that real estate values rise or fall with market conditions, principally adjusts for the effects of GAAP depreciation and amortization of real estate assets.
The Company believes that GAAP net income (loss) is the most directly comparable measure to NOI. NOI should not be considered to be an alternative to GAAP net income (loss) as an indication of the Company's financial performance or GAAP net cash provided by operating activities as a measure of the Company's liquidity; nor is it indicative of funds available for the Company's cash needs, including its ability to make cash distributions. Because of the inclusion of items such as interest, depreciation, and amortization, the use of GAAP net income (loss) as a performance measure is limited as these items may not accurately reflect the actual change in market value of a property, in the case of depreciation and in the case of interest, may not necessarily be linked to the operating performance of a real estate asset, as it is often incurred at a parent company level and not at a property level.
The Company believes that FFO and Core FFO provide enhanced comparability for investor evaluations of period-over-period results. The Company believes that GAAP net income (loss) is the most directly comparable measure to FFO. The principal limitation of FFO is that it does not replace GAAP net income (loss) as a financial performance measure or GAAP cash flow from operating activities as a measure of the Company's liquidity. Because FFO excludes significant economic components of GAAP net income (loss) including depreciation and amortization, FFO should be used as a supplement to GAAP net income (loss) and not as an alternative to it. Furthermore, FFO is not intended as a measure of a REIT's ability to meet debt principal repayments and other cash requirements, nor as a measure of working capital. FFO is calculated in accordance with the Company's interpretation of standards established by Nareit, which may not be comparable to FFO reported by other REITs that interpret the Nareit definition differently. Certain financial information has been revised to reflect reclassifications in prior periods to conform to current period presentation.
Attachment